Canvas Course Analytics
Course-level Analytics allows instructors to track average course grades for your student submissions using an interactive chart graph or table. Although the data is view-only and cannot be changed, the page views and participation metrics include an aggregate across all devices, including Canvas mobile apps. Get to know more about the benefits of the new Course-level Analytics
Data is refreshed in New Analytics every 24 hours. Only active student enrollments are included in data for New Analytics.
How to Access the New Analytics:
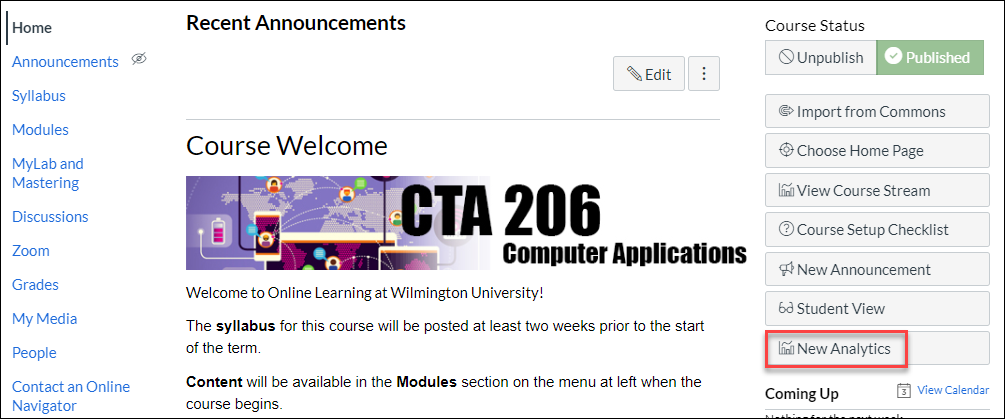
New Analytics can be accessed from the right-side menu:
When Would I Use New Analytics?
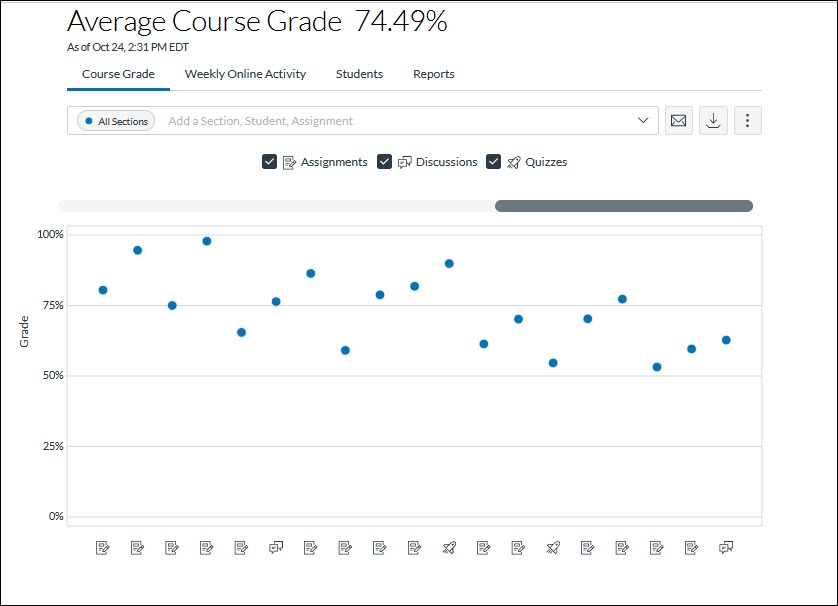
Currently, New Analytics allows instructors to track average course grades for student submissions using an interactive chart graph or table. Data is for viewing only and cannot directly be changed.
Page views and participation metrics include an aggregate across all devices, including Canvas mobile apps. Below is an example report:
Use New Analytics to:
- View average course grade analytics as an interactive chart graph or a data table.
- Compare the course average with an individual assignment, course section, or student filter using the chart graph comparison or data table comparison.
- View average weekly online participation analytics as an interactive chart graph or a data table.
- Compare the course average weekly online participation analytics with an individual student or section using the chart graph comparison or data table comparison.
- Send a message to all students based on specific course grade or participation criteria.
- Send a message to an individual student based on specific course grade or participation criteria.
- View course grade and participation analytics for an individual student.